Physics Education Statistics
APS provides data to track those who earn physics and science, technology, engineering, and mathematics (STEM) degrees with particular attention to women and students from historically marginalized races and ethnicities.
Please email the APS Education team to request raw data for any chart. When sharing any of the charts, cite IPEDS and APS as the source.
Bachelor's degrees in physics and STEM
This graph shows the total number of physics bachelor's degrees and STEM bachelor’s degrees conferred as the first or second major at U.S. institutions. The data include both U.S. citizens and residents as well as temporary residents.
Bachelor's degrees in physics and STEM earned by women
This graph shows the percentage of U.S. bachelor's degrees awarded to women in physics and in all STEM fields. The data include both U.S. citizens and residents and temporary residents.
Physics degrees earned by women
This graph shows the percentage of U.S. bachelor's and doctoral degrees awarded to women in physics. The data include both U.S. citizens and residents as well as temporary residents.
Degrees earned by women, by field
This graph shows a five-year average (2017-2021) of percentage of bachelor's, master's, and doctoral degrees awarded to women in Science, Technology, Engineering, and Mathematics (STEM) fields.
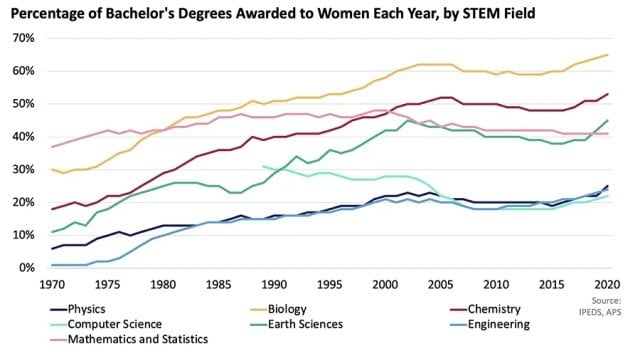
Bachelor's degrees earned by women, by major
This graph shows the percentage of U.S. bachelor's degrees awarded to women in Science, Technology, Engineering, and Mathematics (STEM) fields. The data include both U.S. citizens and residents and temporary residents.
Doctoral degrees earned by women, by major
This graph shows the percentage of U.S. doctoral degrees awarded to women in all fields and various Science, Technology, Engineering, and Mathematics (STEM) disciplines.
Physics doctoral degrees earned by women, by citizenship
This graph shows the percent of physics doctoral degrees earned by women, and their respective distribution to permanent and temporary residents in the United States.
Bachelor's degrees earned by African Americans, by major
This graph shows the percent of U.S. bachelor's degrees awarded to Black and African American students in Science, Technology, Engineering, and Mathematics (STEM) fields, as well as the percent of college-age (18-24 years) individuals who are Black or African American.
Bachelor's degrees earned by Hispanic Americans, by major
This graph shows the percent of U.S. bachelor's degrees awarded to Hispanic or Latino students in STEM fields, as well as the percent of college age (18-24 years) individuals who are Hispanic or Latino.
Physics degrees earned by individuals marginalized by race/ethnicity
This graph shows the percentage of bachelor's, master's, and doctoral degrees awarded to individuals marginalized by race/ethnicity in physics at U.S. institutions. In this case, the individuals marginalized by race/ethnicity include Black and African Americans, Hispanic and Latino Americans, American Indians, Alaska Natives, Native Hawaiians, and other Pacific Islanders. Also included is the percent of college-age (18-29 years) individuals in the United States who are marginalized by race/ethnicity.
Degrees awarded to temporary residents are excluded from calculations. Data on the college age population are collected from the U.S. Census.
Degrees awarded to individuals marginalized by race/ethnicity, by field
This graph shows a five-year average (2017-2021) of percentage of US degrees awarded to individuals marginalized by race/ethnicity in Science, Technology, Engineering, and Mathematics (STEM) fields at United States institutions. In this case, the individuals marginalized by race/ethnicity include Black and African Americans, Hispanic and Latino Americans, American Indians, Alaska Natives, Native Hawaiians, and other Pacific Islanders.
Degrees awarded to temporary residents are not included in the calculations.
Retention of individuals marginalized by race/ethnicity in physics
This graph shows the five-year average (2017-2021) percentage of individuals marginalized by race/ethnicity in physics compared to both the percentage of individuals marginalized by race/ethnicity in the U.S. college age population and among all degrees awarded. In this case, the individuals marginalized by race/ethnicity include Black and African Americans, Hispanic and Latino Americans, American Indians, Alaska Natives, Native Hawaiians, and other Pacific Islanders.
Degrees awarded to temporary residents are not included in the calculations. Data on the college age population are collected from the U.S. Census. The American Institute of Physics (AIP) provides data on physics faculty.
Physics bachelor's degrees by gender and race/ethnicity
This graph shows a five-year average (2017-2021) of the percent of physics bachelor’s degrees granted to men and women for various races and ethnicities.
Physics degrees by race/ethnicity
This graph illustrates a five-year average (2017-2021) of the percent of physics bachelor's, master's, and doctoral degrees awarded to people of various races and ethnicities.
Degrees awarded to temporary residents are not included in the calculations. Data on the college age population are collected from the U.S. Census.
Physics bachelor’s degrees awarded to African Americans at HBCUs
This graph shows the raw numbers of physics bachelor's degrees awarded to African Americans at Historically Black Colleges and Universities (HBCUs) compared to that of all U.S. institutions.
Physics degrees earned by temporary residents
This graph shows the percentage of U.S. physics bachelor's, master's, and doctoral degrees awarded to temporary residents.
Physics doctoral degrees by citizenship
This graph shows the number of physics PhDs earned by U.S. citizens and permanent residents as compared to physics PhDs earned by temporary residents.
High school teachers with a physics degree
Only 47% of physics classes are taught by a teacher with a degree in the subject, compared with 73% of biology classes and about 80% of humanities classes.
Credit: U.S. Department of Education
Students taking high school physics
The numbers of high school students taking physics has been growing rapidly: over the past two decades, that number has more than doubled to 1.38 million students, with the number of Advanced Placement or second-year physics students increasing more than nine-fold to 229,000.
Credit: AIP
Data collection
That data in these charts are collected from the Integrated Postsecondary Education Data System (IPEDS) provisional releases for each year, which are sourced from every institution on the National Center for Education Statistics list of institutions. This list includes institutions based on degree-granting status and participation in Title IV federal financial aid programs.
Data include all physics degrees as well as degrees that are frequently awarded in physics departments, such as engineering or applied physics, astrophysics, and physics teacher education. At institutions that have separate departments for these degrees, the data reflect the total number of degrees awarded in physics and allied departments. For physics teacher education degrees to be counted, the institution must offer at least a physics minor.
The values which fall under this definition within the Academic Discipline, 6-Digit Classification of Instructional Program (CIP) classification variable are:
- 13.1329 PHYSICS TEACHER EDUCATION
- 13.1329 PHYSICS TEACHER EDUCATION
- 14.1201 ENGINEERING PHYSICS/APPLIED PHYSICS
- 40.0202 ASTROPHYSICS
- 40.0299 ASTRONOMY AND ASTROPHYSICS, OTHER
- 40.0801 PHYSICS, GENERAL
- 40.0802 ATOMIC/MOLECULAR PHYSICS
- 40.0804 ELEMENTARY PARTICLE PHYSICS
- 40.0805 PLASMA AND HIGH-TEMPERATURE PHYSICS
- 40.0806 NUCLEAR PHYSICS
- 40.0807 OPTICS/OPTICAL SCIENCES
- 40.0808 SOLID STATE AND LOW-TEMPERATURE PHYSICS
- 40.0810 THEORETICAL AND MATHEMATICAL PHYSICS
- 40.0899 PHYSICS, OTHER
- 51.2205 HEALTH/MEDICAL PHYSICS
STEM stands for Science, Technology, Engineering, and Mathematics. APS uses the definition of STEM identified by the Department of Homeland Security in their 2022 List of STEM Degree Programs, and APS also includes degrees from STEM teacher preparation programs (relevant CIP codes under 13.13).
For more information on CIP codes, see the CIP user site, or email education@aps.org with questions about the statistics presented on this website.
For underrepresented ethnic/racial minorities, we include the following categories for students who are U.S. citizens or permanent residents:
- Black or African American
- Hispanic or Latino
- Native Hawaiian or other Pacific Islander
- American Indian or Alaska Native
The number of degrees awarded to temporary residents is not included when calculating the percentage of degrees awarded other individuals from marginalized races/ethnicities.
Related

Data on the educational attainment and experiences of diverse groups within physics and science, technology, engineering, and mathematics.
Data on physics and related education levels earned by different demographic groups.

We support physics departments, faculty, and K-12 teachers in preparing the next generation of physics students and physicists.

Classroom lessons, charts, webinars, and case studies to support physics education, research, and advocacy.