Diversity in Physics
Statistics on underrepresented racial and ethnic groups in physics
These reports, generated by APS and the American Institute of Physics (AIP), track educational attainment of underrepresented racial and ethnics groups in physics and in science, technology, engineering, and mathematics (STEM) more broadly.
These charts are organized first by race, followed by gender.
Contact education@aps.org to get a raw download of chart data. When sharing any of the charts, cite IPEDS, AIP, and APS as the source.
Bachelor's degrees earned by African Americans, by major
This graph shows the percent of U.S. bachelor's degrees awarded to Black and African American students in Science, Technology, Engineering, and Mathematics (STEM) fields, as well as the percent of college-age (18-24 years) individuals who are Black or African American.
Bachelor's degrees earned by Hispanic Americans, by major
This graph shows the percent of U.S. bachelor's degrees awarded to Hispanic and Latino students in STEM fields, as well as the percent of college age (18-24 years) individuals who are Hispanic or Latino.
Physics degrees earned by individuals marginalized by race/ethnicity
This graph shows the percentage of bachelor's, master's, and doctoral degrees awarded to individuals marginalized by race/ethnicity in physics at U.S. institutions. In this case, the individuals marginalized by race/ethnicity include Black and African Americans, Hispanic and Latino Americans, American Indians, Alaska Natives, Native Hawaiians, and other Pacific Islanders. Also included is the percent of college-age (18-29 years) individuals in the United States who are marginalized by race/ethnicity.
Degrees awarded to temporary residents are excluded from calculations. Data on the college age population are collected from the US Census.
Degrees awarded to individuals marginalized by race/ethnicity, by field
This graph shows a five-year average (2017-2021) of percentage of US degrees awarded to individuals marginalized by race/ethnicity in Science, Technology, Engineering, and Mathematics (STEM) fields at United States institutions. In this case, the individuals marginalized by race/ethnicity include Black and African Americans, Hispanic and Latino Americans, American Indians, Alaska Natives, Native Hawaiians, and other Pacific Islanders.
Degrees awarded to temporary residents are not included in the calculations.
Retention of individuals marginalized by race/ethnicity in physics
This graph shows the five-year average (2017-2021) percentage of individuals marginalized by race/ethnicity in physics compared to both the percentage of individuals marginalized by race/ethnicity in the U.S. college age population and among all bachelor's degrees awarded. In this case, the individuals marginalized by race/ethnicity include Black and African Americans, Hispanic and Latino Americans, American Indians, Alaska Natives, Native Hawaiians, and other Pacific Islanders.
Degrees awarded to temporary residents are not included in the calculations. Data on the college age population are collected from the U.S. Census. Data on physics faculty comes from AIP.
Physics bachelor's degrees by gender and race/ethnicity
This graph shows a five-year average (2017-2021) of the percent of physics bachelor’s degrees granted to men and women for various races and ethnicities.
Degrees awarded to temporary residents are not included in the calculations.
U.S. Indigenous includes American Indians, Alaska Natives, Native Hawaiians, and other Pacific Islanders; see the Glossary in the EP3 Guide section on Equity, Diversity, and Inclusion for more discussion of terminology.
Physics degrees by race/ethnicity
This graph illustrates a five-year average (2017-2021) of the percent of physics bachelor's and doctoral degrees awarded to people of various races and ethnicities.
Degrees awarded to temporary residents are not included in the calculations. Data on the college age population are collected from the U.S. Census.
Physics bachelor's degrees awarded to African Americans at HBCUs
This graph shows the raw numbers of physics bachelor's degrees awarded to African Americans at Historically Black Colleges and Universities (HBCUs) compared to that of all U.S. institutions.
Statistics on women in physics
These reports, generated by APS and AIP, track educational attainment and career paths of women in physics.
Bachelor's degrees in physics and STEM earned by women
This graph shows the percentage of U.S. bachelor's degrees awarded to women in physics and in all STEM fields. The data includes both U.S. citizens and residents and temporary residents.
Physics degrees earned by women
This graph shows the percentage of U.S. bachelor's and doctoral degrees awarded to women in physics. The data includes both U.S. citizens and residents as well as temporary residents.
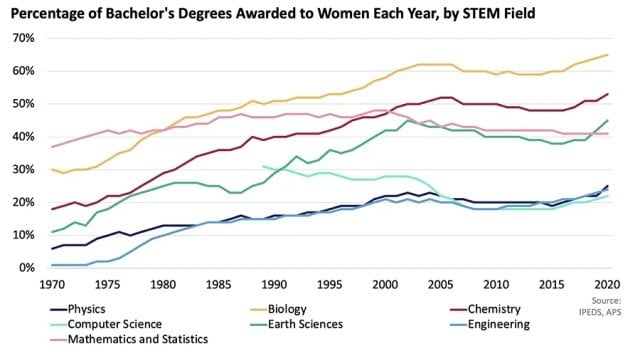
Bachelor's degrees earned by women, by major
This graph shows the percentage of U.S. bachelor's degrees awarded to women in STEM fields. The data includes both U.S. citizens and residents and temporary residents.
Doctoral degrees earned by women, by major
This graph shows the percentage of U.S. doctoral degrees awarded to women in all fields and various Science, Technology, Engineering, and Mathematics (STEM) disciplines.
Degrees earned by women, by field
This graph shows a five-year average (2017-2021) of percentage of bachelor's, master's, and doctoral degrees awarded to women STEM fields.
Physics doctoral degrees earned by women, by citizenship
This graph shows the percent of physics doctoral degrees earned by women, and their respective distribution to permanent and temporary residents in the United States.
The LGBT+ climate in physics report
An APS Committee on LGBT+ issues interviewed and surveyed LGBTQ+ individuals in physics to asses their experiences in the scientific community.
Read the report
Related

Discover which demographic groups have earned physics degrees at different education levels over time.
Data on physics and related education levels earned by different demographic groups.

We're committed to fostering a welcoming physics community where everyone passionate about science can succeed.
A detailed climate survey, including in-depth interviews with individuals who self-identify as LGBT+.